Graphs

Impacts of the Pollution

Although you might think its nothing more than a tiny bit of inconvenience noise pollution can affect us in ways that we might be oblivious to.Infact, in the long term it can have far reaching impacts on our health as well.

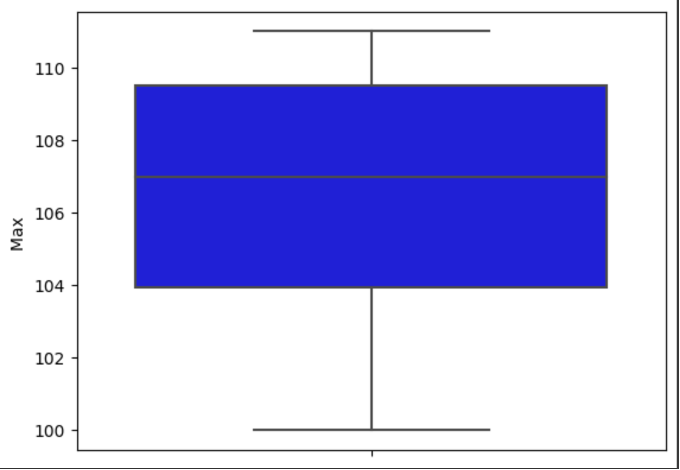
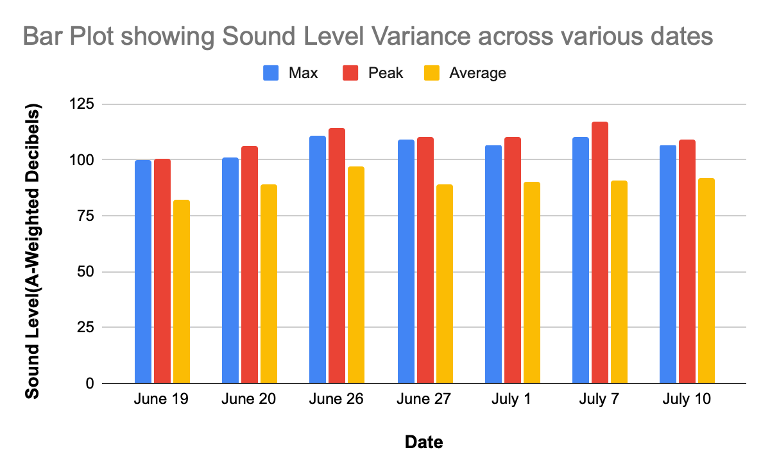
The chart below displays the tolerance levels to high decibel sounds against a chart displaying the data we measured in Mumbai :

LinePlot of the values with Danger Threshold

LinePlot with data values for all three data sets

The green dotted line displays a threshold which correlates to the “danger threshold’ , we also see a similar change in hue on the scale.We see how the peak and max values remain consistently above the threshold.[Image 1] indicates how the exposure to sounds between 105db to 115 db is ranging from 15 minutes to 30 seconds respectively, and where the noise levels lie on the higher end of this scale it is fair to say that even the sporadic outburst of noise can lead to hearing damage.

Similarly [Image 3] shows the same trend with specific values plotted, the max peak value lies at 114db which skews by 5db from the average peak value of 109.5db.Additionally,the chart below compares it to some common noises in our everyday life:

With the graph indicating that it is advisable to wear earplugs when exposed to sounds near 100db and the fact that areas where the metro excavation work is conducted are residential , for example SV road , Jama Masjid and even Buddha, the people affected are not only the workers who work at these sites but also the people who live nearby.The following is a list of the problems it can cause:

  • high blood pressure
  • faster heart rate
  • upset stomach
  • problems sleeping, even after the noise stops
  • problems with how babies develop before birth


Parameters

The study was limited to the use of A-weighted Decibels, which measure noise taking into account the sensitivity of the human ear. It adjusts the loudness accordingly to better perceive how the human hearer would perceive the loudness. Additionally, the study only shows the readings recorded over a limited time span of 12 days and the additional days required to gather preliminary data to conduct this study. It also takes into account and illustrates the peak values which are recorded by the noise level meter(DecibelX) on my mobile phone and although it does display other values as well, it puts emphasis on the effects of the peak values